Node Bulletin Board
A Node.js sample app which shows an event bulletin board, using Vue.js for the front-end and SQL Server for storage. The app runs in containers and the only pre-requisite for building and running the whole stack is Docker.
Credits
The original app is from Vue Events Bulletin Board and the Prometheus integration comes from Example Prometheus Monitoring.
Tech Stack
The entrypoint to the app is an Nginx container, which acts as a reverse proxy to the Node.js application container. The application container stores data in the SQL Server container, and it also exposes instrumentation metrics which are scraped by a Prometheus container. The Prometheus metrics are exposed in a dashboard from the Grafana container.
Usage
The Docker Compose file uses an environment variable for your Docker ID, so you can build the images and push to Docker Hub. Start by capturing your Docker ID in an environment variable:
export dockerId='<your-docker-id>'
Build Docker images
Build the application and database images using Docker Compose:
docker-compose build
Run the app
You can run the app using the same compose file:
docker-compose up -d
Browse to localhost to use the app.
Configure Grafana
The compose file runs Prometheus to collect metrics and Grafana to show an application dashbaord. Grfana needs some additional setup.
Browse to localhost:3000 and log in to Grafana with the credentials admin / admin.
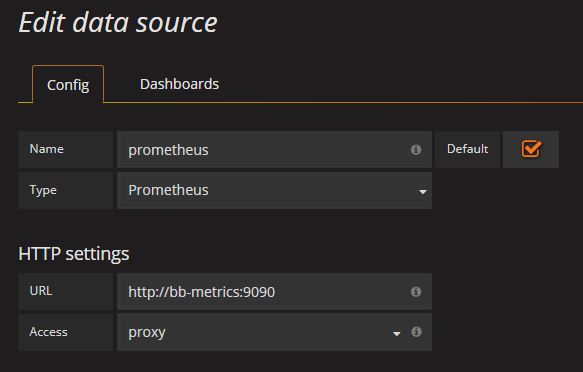
Add a new data source with the following details:
-
Name: prometheus
-
Type: Prometheus
From the Grafana icon, click Dashboards... Import and load the JSON dashboard file from bulletin-board-dashboard/dashboard.json. Select the Prometheus data store.
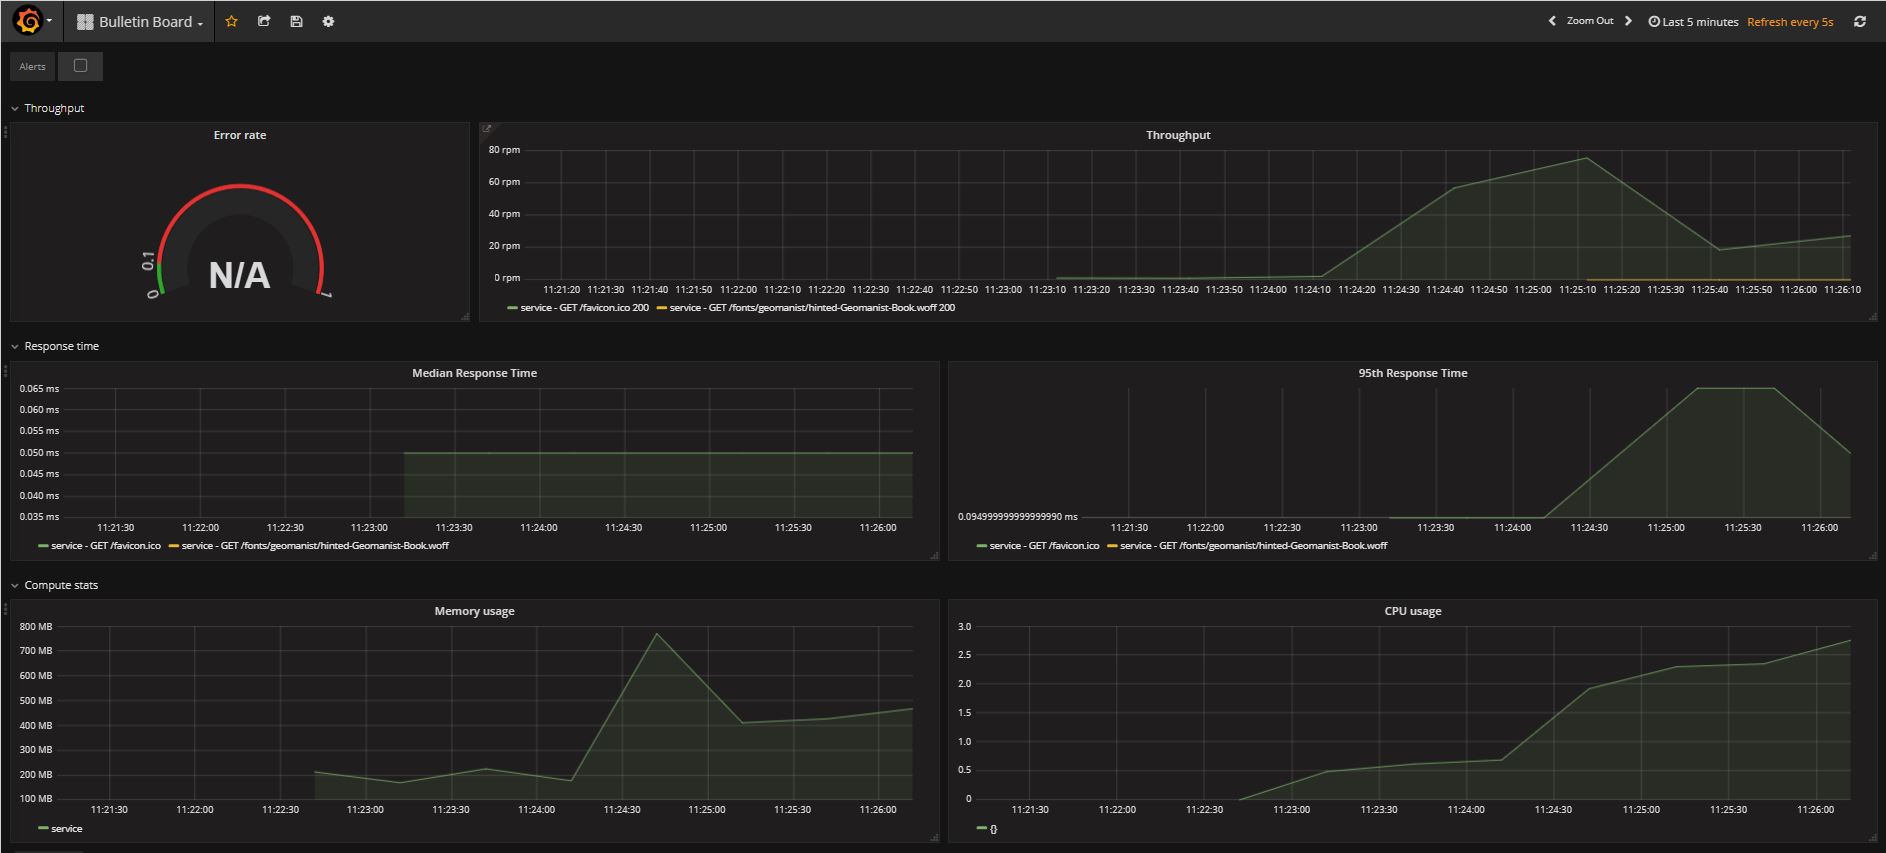
You'll now see the application dashboard - send some load into the app by refreshing the browser, and the graphs will be populated:
You can save the configured Grafana container as an image, which persists all the setup changes.
docker container commit nodebulletinboard_bb-dashboard_1 $dockerId/bulletin-board-dashboard
Running in swarm mode
You can deploy the app to a Docker swarm for high availability and scale. A single-node swarm is fine for testing.
If you're running the app from compose, first remove all the containers:
docker-compose down
Switch to swarm mode:
docker swarm init
If your Docker host has multiple IP addresses, you'll need to specify the local network IP in the
advertise-addroption.
Then deploy the application as a stack:
docker stack deploy -c docker-stack.yml bb
You can browse to the app at the server address, and to the configured Grafana instance at port 3000.


